Reports

Display Costs Smartphones

Semi-Annual Smartphone Display Cost Report

Semi-Annual

Due to the growing penetration of OLEDs into smartphones, Counterpoint has developed a cost model that compares and forecasts LTPS and OLED smartphone display costs. The cost model also examines all of the different form factors currently or coming into the smartphone market. Panel covered include - ​Rigid 5.5"/6.0" 16:9, 6.0"/6.4" 18-19.5:9, Flexible 5.5" 16:9, 5.8"/6.0"/6.2"/6.5" 18-19.5:9 . ​More displays will be added as these categories continue to emerge. Includes detailed BOM results and forecasts, panel prices and panel margins.
Read More

Display Materials

Quarterly Display Glass Report

Quarterly

This report tracks glass capacity and shipments for all major glass makers across all LCD and OLED display fabs. The report combines Counterpoint’s comprehensive insight into industry capacity and utilization with in-depth understanding of display glass and the supply chain.
Read More
Display Trends Display Equipment OLEDs TV

Quarterly All Display Fab Utilization Report​

Quarterly

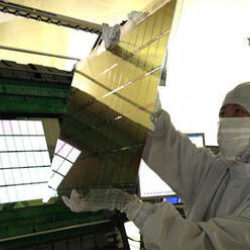
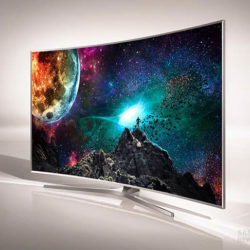
Counterpoint's Quarterly All Display Fab Utilization Report takes into account the financial performance of many equipment and material manufacturers that are directly involved in FPD manufacturers' production line utilization rates. It reveals quarterly production capacity and glass substrate input for all OLED and LCD production lines. Information is presented on a quarterly basis and forecast data for the relevant calendar year is also provided.
Read More

OLEDs

Quarterly OLED and Mobile/IT LCD Fab Utilization Report

Quarterly

With a number of equipment and materials suppliers’ financial results dictated by panel suppliers’ fab utilization, we developed this service to help companies, industry analysts and financial analysts assess the impact of OLED and mobile LCD suppliers’ fab utilization on company performance and the industry outlook.
Read More