DSCC
[email protected]
FOR IMMEDIATE RELEASE: 08/26/2024
Global TV Market Returned to Growth in Q2’24
La Jolla, CA -
- Global TV shipments increased 3% Y/Y in Q2'24, following three consecutive quarters of declines.
- Samsung maintained its position as the top brand but its share decreased to the lowest point since at least 2021.
- Shipments of very large TVs continued to outpace the overall market with 80”+ TVs increasing 29% Y/Y.
After three consecutive quarters of Y/Y declines, the global TV market recovered for a Y/Y growth in Q2’24, fed by strong shipments to developed regions gearing up for major sporting events. TV shipments in the quarter increased 3% Y/Y despite weak shipment numbers in the #3 geographic region, China.
The Counterpoint Research Global TV Tracker is the first report prepared by the combined resources of Counterpoint with DSCC. The tracker includes shipment and revenue figures for the top 16 global TV brands, with pivot tables for detailed analysis including geographic region, brand, screen size, resolution, price band and other parameters. The Tracker includes history from Q1'22 up to Q2'24 and is updated quarterly.
Both North America and Western Europe posted 14% gains Y/Y and were joined by Eastern Europe in the double-digit category, growing 15% Y/Y. On the other hand, shipments dropped dramatically in China with a 21% Y/Y decrease in Q2, the fourth consecutive quarterly Y/Y decline and the third consecutive decline in double digits %.
Samsung continues to maintain its leading position in TV shipments, but its share fell below 15% for the first time in more than two years. Samsung shipments were flat Y/Y in Q2’24 at 8.2M, and with the overall market growing Samsung’s share dropped from 15.1% in Q2’23 to 14.6% in Q2’24.
Global TV Unit Share of Major Brands, Q1’22 to Q2’24
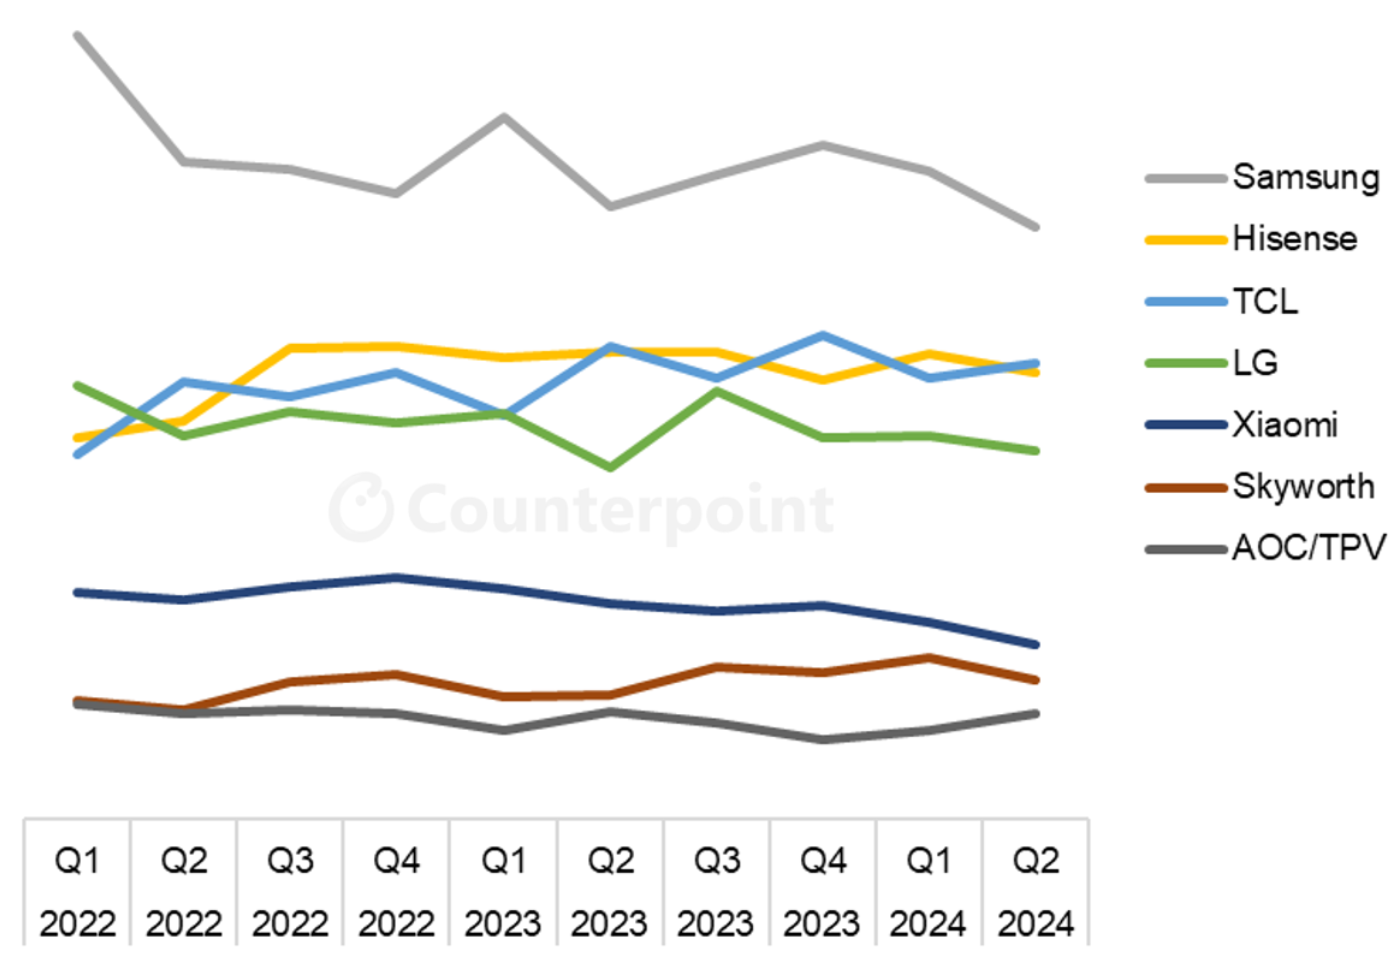
The battle for #2 in the global TV market has been a three-way race between Hisense, TCL and LG, but LG has fallen behind its two Chinese rivals in the last year. Hisense and TCL have been trading places for the last five quarters, and Q2'24 was TCL’s turn to take the #2 spot while Hisense came in at #3.
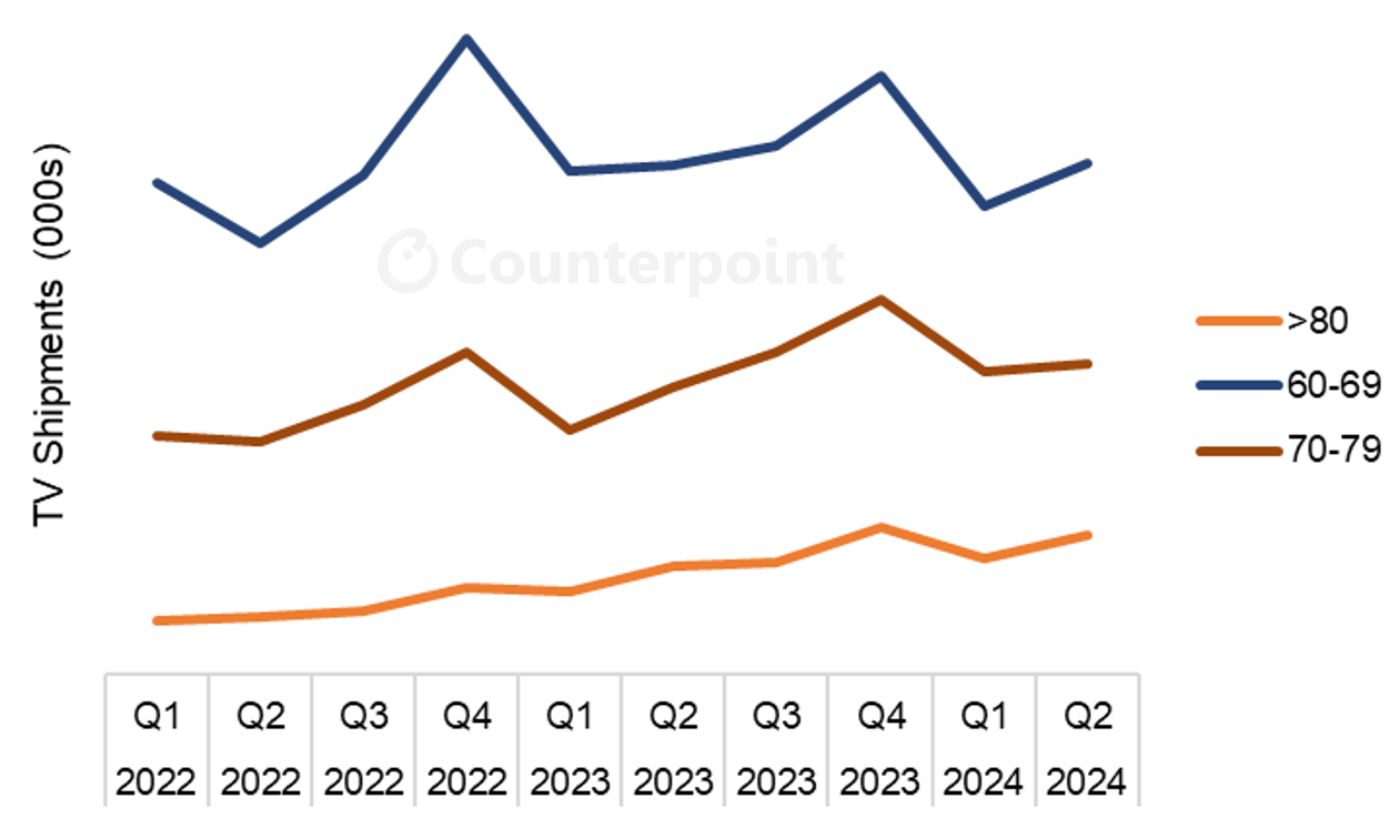
Looking at a different cut of the data shows the encouraging growth of large screen sizes. While shipments of TVs below 40” decreased by 7% Y/Y, shipments in all screen sizes larger than 40” increased Y/Y. Shipments of 60-69” TVs managed only a 1% increase Y/Y, but shipments of TVs from 70-79” increased by 8% Y/Y and shipments of TVs 80” and larger increased by 29% Y/Y.
TV Unit Shipments by Screen Size Category, Q1’22 to Q2’24
The Counterpoint Research Global TV Tracker provides a comprehensive tool to analyze and understand the TV market. Readers interested in subscribing to the Global TV Tracker should contact [email protected].
About Counterpoint
Counterpoint Research is a global market research firm specializing in products across the technology ecosystem. We advise a diverse range of clients – from smartphone OEMs to chipmakers and channel players to Big Tech – through our offices located in the world's major innovation hubs, manufacturing clusters and commercial centers. Our analyst team, led by seasoned experts, engages with stakeholders across the enterprise – from the C-suite to professionals in strategy, analyst relations (AR), market intelligence (MI), business intelligence (BI), product and marketing – to deliver services spanning market data, industry thought leadership and consulting. Our core areas of coverage include AI, Automotive, Consumer Electronics, Displays, eSIM, IoT, Location Platforms, Macroeconomics, Manufacturing, Networks and Infrastructure, Semiconductors, Smartphones and Wearables. Visit our Insights page to explore our publicly available market data, insights and thought leadership, and to understand our focus, meet our analysts and start a conversation.